


Options#
If the future is an obligation, the option is a right. Whoever buys a call acquires the right, not the obligation, to buy the underlying at a predetermined price (the strike) by or on a certain date (the expiry). Whoever buys a put acquires the right to sell on the same terms. Whoever sells the option (the writer) collects a premium upfront and takes on the mirror-image obligation: to suffer exercise whenever it suits the buyer. The asymmetry is all here: the buyer can lose at most the premium, the seller can lose far more. This page builds the minimum vocabulary needed to handle that asymmetry; the next one (Volatility risk premium) will explain why, on average, it is paid more than it should be.
Anatomy of a price#
The payoff at expiry is elementary: a put with strike K is worth max(K − S, 0), where S is the index level. Before expiry, however, the option is worth more than its intrinsic value (the part already in the money): there is a time value, reflecting the possibility that the underlying moves in the buyer’s favor before expiry. Time value is greatest for at the money options (ATM, strike near the current price), declines moving out of the money (OTM) or in the money (ITM), and goes to zero at expiry. Selling options is, in essence, selling time value: the seller collects money today for an obligation that, if the world stays quiet, evaporates day after day.
Where does the “right” price come from? From the usual no-arbitrage principle (Derivatives page). Black, Scholes and Merton showed that an option’s payoff can be replicated with a dynamic portfolio of the underlying and the risk-free asset, continuously rebalanced: the option’s price is the cost of that replication. We do not need the full formula here; we need its three conceptual consequences. First: as with the future, the expected return of the underlying does not enter the price — the option is priced under the Q measure. Second: the only unobservable parameter in the formula is the future volatility of the underlying; everything else (spot, strike, rate, dividends, time) can be read off the newspaper. Third, and this is the point on which the entire site rests: whoever sells an option and replicates its hedge is making a bet purely on volatility — they win if realized volatility comes in below the volatility paid for in the premium, lose in the opposite case, whatever the market’s direction does. The DHCS strategy (DHCS page) is exactly this, done with discipline.
Implied volatility: the true price of options#
Since volatility is the only unknown ingredient, the options market is in effect a market for volatility. Inverting the formula — given the option’s market price, what volatility justifies it? — yields the implied volatility (IV). Professionals do not quote options in dollars but in IV points: saying “this put trades at 18% vol” is like stating the price of the insurance, normalized for strike and expiry. The VIX, which you will meet constantly, is nothing but a weighted average of the IVs of 30-day SPX options: the list price of insurance on the US stock market.
If the Black-Scholes model were literally true, all options on the same underlying would have the same IV. That never happens. On the equity index, OTM puts systematically trade at higher IVs than OTM calls and ATM options: this is the skew (or smirk). The standard explanation, which Natenberg calls investment skew, is mechanical: the world is structurally long equities, so it buys protection at low strikes (protective puts) and sells participation at high strikes (covered calls). Buying pressure at the bottom, selling pressure at the top: the IVs tilt accordingly. To this flow-based explanation a substantive one was added after 1987: the market learned that the index can jump downward, and the skew prices that possibility. For sellers the skew is a central fact: it means that insurance against crashes — precisely the merchandise of this site — is the most expensive item on the whole chain. Whether it is too expensive is the question of the Volatility risk premium page.
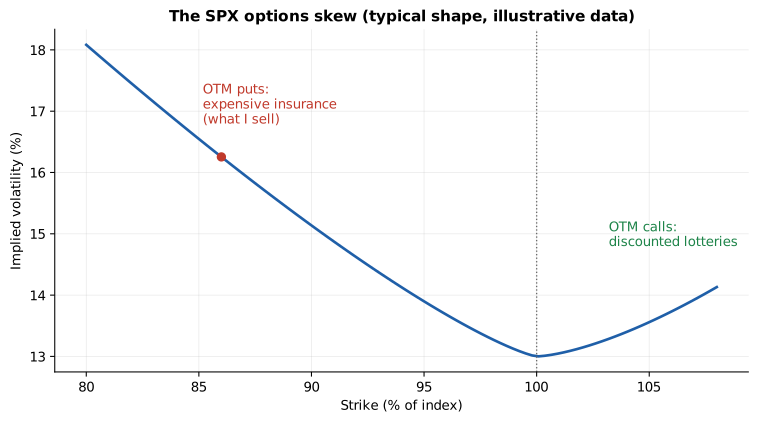
The typical shape of the SPX skew: IV rises as the strike falls. OTM puts (on the left) are the most expensive insurance on the chain; OTM calls (on the right) the discounted lottery tickets.
The surface also has a time dimension: the term structure of IV. In normal times it slopes upward (long maturities trade at higher IVs than short ones: more time, more uncertainty to price, more premium for the long-dated seller’s vega); in moments of stress it inverts — one-week IV shoots above one-year IV, because the perceived danger is all here and now. For the seller the inversion is precious regime information: hysterical rates at short maturities, which is exactly where this site’s strategies operate. Finally, two language conventions I will use everywhere: moneyness is measured interchangeably in percent OTM, in delta or in standard deviations (a “−1σ” put sits roughly one standard deviation of the remaining period away from the price), and expiry in DTE (days to expiry): 0DTE expires today, 1DTE tomorrow, and so on.
The greeks: the parameters to monitor#
An option’s price depends on several variables, and the greeks measure the sensitivity to each. For a seller, four are enough.
Delta: the change in the option’s price per one-point move in the underlying. A short put has positive delta for the seller: if the index rises, the put deflates and the seller gains. Delta is also a (rough but useful) approximation of the Q probability that the option expires ITM: selling a put at 0.05 delta means selling something the market prices with roughly a 5% probability of finishing in the money. The TRPS’s 1DTE puts have average deltas of 0.003: three times in a thousand, says the chain. Says the chain, indeed: I will come back to the difference between that number and the real-world frequency.
Gamma: the change in delta per point of underlying. It is convexity in action, and it is the seller’s enemy number one: a short option position has negative gamma, meaning the delta moves against you — the more the market falls, the more your downside exposure grows, precisely as it falls. Gamma explodes for ATM options close to expiry: that is why the DHCS rolls positions before expiry and why 0DTE sellers live dangerously around nearby strikes.
Theta: the change in price per passing day. For the seller it is positive: it is the daily paycheck, the time value evaporating. The decay is not linear: it accelerates as expiry approaches (for ATM options it grows as the inverse of the square root of remaining time), and it is why short maturities are, all else equal, the “densest” in premium per day of risk carried — a fact that both strategies in the Strategies section exploit, each in its own way. Gamma and theta are two sides of the same coin, tied by a precise relationship: you collect theta exactly to the extent that you are exposed to gamma. There is no rent without convexity sold. When someone pitches you a strategy “that profits from time decay without risk”, now you know what to tell them.
Vega: the change in price per point of IV. The seller is short vega: if implied volatility rises, the options you sold appreciate and you lose, even if the index has not moved. It is the mechanism that turns a simple market scare into an immediate mark-to-market loss, and it is what triggers the stops long before the strike is threatened. Vega grows with maturity: the DHCS’s 30-day options carry plenty of it, the TRPS’s 1DTE options very little — a structural difference between the two strategies I will return to on the TRPS vs DHCS page.
Put-call parity#
For European options like the SPX, an accounting relationship — not a model — holds at every instant: call − put + risk-free asset = underlying (same strike and expiry). Buying a call and selling a put creates a synthetic underlying; any violation is immediate arbitrage. The parity has two uses in these pages. The first is practical: every position has a synthetic equivalent (a covered call is a short put, a short put is a covered call), and it always pays to pick the version that is more efficient on margins, costs and taxes. The second is conceptual, and I borrow it from the source of the TRPS (Resources page): writing the parity in terms of expected returns, E[long call] + E[short put] = E[equity premium]. If long calls — lottery-like payoffs, beloved by the public — earn on average little or nothing, then the short put must earn on average at least as much as equities. Not because the market is inefficient: precisely because of how it works. It is the first clue that selling insurance is a paid trade, and the Volatility risk premium page quantifies it.
The option as an insurance policy#
I close with the metaphor that will guide everything that follows. An index put is an insurance policy: the strike is the coverage limit, the expiry is the policy term, the premium is the premium (the names are no accident), and the IV is the rate per unit of risk. Whoever buys it sleeps better; whoever sells it plays the insurer, with everything that entails: small, frequent collections, rare and large claims, and the absolute necessity of adequate rates, capital reserves and underwriting discipline. The risk management pages (Risk management section) are the actuary’s manual; the strategy pages (Strategies section) the underwriting manual. First, though, we need to verify that the trade pays: that the average rate exceeds the average claim. That is the volatility risk premium, and it is the next page.