


The curious case of Universa Investments#
In Francis Scott Fitzgerald’s short story — and in the David Fincher film that made it famous — the strange thing about Benjamin Button is not that he ages badly: it is that he travels the arrow of time backwards, born old and growing younger, against the natural order of things. Finance has an equally well-respected arrow: the trade-off between risk and return. If you want more expected return, you carry more risk; if you want less risk, you leave some return on the table. This whole site, at bottom, revolves around that arrow: the VRP is the price of a real risk, and whoever collects it must carry its tail.
Then there is Universa Investments. The tail-risk hedging fund founded by Mark Spitznagel in 2007 — with Nassim Taleb, the author of The Black Swan you’ll find in the Resources, as its scientific advisor — claims to travel the arrow backwards: more return with less risk. Not “less risk in exchange for a bit of return”, which would be the ordinary trade of every insurer: more return because of the protection. And every now and then the headlines seem to prove it, with numbers you don’t forget: in April 2020, with markets still reeling from COVID, Bloomberg reported that Universa’s fund had returned +3,612% in March, +4,144% year to date. The figures came from an investor letter the firm calls a “decennial letter”, because as a rule it writes one every ten years: that time, the occasion deserved an exception. I’ll confess my first reaction: if this is true, I picked the wrong trade.
An insurance policy that pays you instead of costing you: the curious case indeed. This chapter closes the section with an exercise in critical reading — where does the math end and the marketing begin? — and we have just built the tools to do it together.
The promise: insurance that pays you#
Universa’s trade is the exact mirror image of mine. On the Volatility risk premium page I described the marginal seller of insurance who collects the premium and carries the tail: Universa is the buyer on the other side of the table. It systematically buys far-OTM puts on the S&P 500, rolls them at expiry, and accepts losing the premium month after month in exchange for explosive convexity in crashes. It is the bleed of the long volatility products I’ve already discussed, elevated to a declared strategy: bleed a little every month, to collect enormously on the day of the crash.
Spitznagel’s thesis — developed in his book Safe Haven — is that risk mitigation must be cost-effective: it is not enough to reduce drawdowns, it must raise the portfolio’s CAGR. Classic diversification, he says, is a confession of inefficiency: you reduce risk while agreeing to pay any price in return. His alternative: a portfolio that is almost entirely equities plus a small allocation — 2-3% — to Universa’s program, which explodes in crashes and hands you ammunition to reinvest at the lows. The declared numbers are seductive: an S&P 500 portfolio with 3.33% in Universa would have compounded, over fifteen years, at roughly 11.8% a year against 9.6% for the index alone. Less tail risk and more compound return.
If those numbers were the whole story, we would be looking at Benjamin Button: a portfolio that grows younger while insuring itself. And for someone who, like me, sits on the short side of those very puts, the question is not academic: if buying protection raises returns, then the VRP I believe I’m collecting does not exist, and I might as well shut down the site. Worth a closer look.
The denominator game#
The first clue that the story is more ordinary than it sounds lies in how Universa reports its returns. That +3,612% is not computed on assets under management, nor on the portfolio the client is protecting: it is the ROIC, return on required invested capital — the gain divided by the sole fraction of capital actually deployed in the options, that is, a few weeks’ worth of premiums. The math is correct: nobody, not even the harshest critics, claims the numbers are false. But the denominator is tiny by construction, and any gain divided by a tiny denominator produces headline-grade percentages.
Aaron Brown — a former risk manager at Morgan Stanley and AQR, now a columnist — offered my favorite analogy: it is like computing the return on a fire insurance policy using a single month’s premium, ignoring the years of premiums paid away before the fire. His orders of magnitude: protecting one billion dollars takes roughly 5 million in puts; in the crash those 5 million become roughly 205 million — “+4,000%” on the premium, sure, but roughly +20% on the billion being protected. Redoing the March 2020 math on the client’s whole portfolio (with the recommended 3.33% allocation), the +4,144% becomes +12.8% for the month — an excellent month, to be clear, to be weighed against an average loss of 0.22% per month in all the years when the fire doesn’t break out.
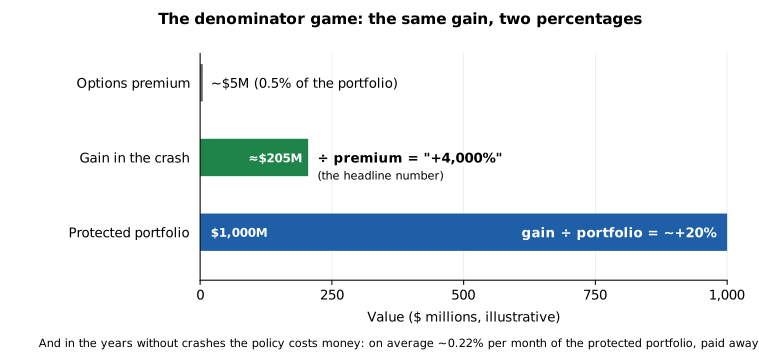
The same dollar gain, three denominators: on a few weeks of premium it makes headlines, on the protected portfolio it makes a good month, and in the quiet years the policy costs money. Illustrative numbers reconstructed from Aaron Brown’s analyses.
Does this sound familiar? It should. On the Capital efficiency page we have just seen that the choice of denominator changes the story a number tells: my 0.5% on notional becomes 2% on the account precisely because margin is a fraction of notional. It is the same game — except that I use it to explain an architecture, and there the risk stays anchored to the notional; here the smallest available denominator is chosen for reporting results. When Bloomberg’s 2023 investigation (by Justina Lee) canvassed the competition, seven tail-risk managers out of eight said they use conventional metrics. Boaz Weinstein of Saba Capital was the sharpest: no other fund — not even the other tail funds — talks about “returns on premia spent over some interval” rather than return on assets. Derek Kaufman, formerly of Citadel, closed with the trade’s proverb: insurance has an average cost by definition, and “if something seems too good to be true, it probably is”. Cliff Asness merely amplified the whole thing to his hundred thousand followers, with the taste for controversy that even his friends concede him.
There is a second asterisk, less quoted but the most instructive of all, because it touches the very way the average is taken. The “life of strategy” return Universa reports (an average +114% a year on invested capital, in the version circulated in 2023) assumes the client rebalances every quarter: topping the position back up after losing quarters and sweeping profits into the S&P after winning ones. Careful not to misread this: the rebalancing does not generate that return — no rebalancing on earth manufactures +114% a year. It makes the number computable. The quarterly returns of a buyer of far-OTM puts have a precise shape: many quarters near −100% of the (small) premium deployed, and every now and then a quarter at +3,000-4,000%. Resetting the capital each quarter turns that series into a collection of fresh bets, whose arithmetic mean can be published: and in arithmetic mean a single +4,000% pays, on its own, for forty quarters at −100%. But try to compound the same series, leaving the money in: the first quarter at −100% zeroes the balance, and the geometric “life of strategy” return is −100%. The end.
Here the chapter touches what is perhaps the most important point on this whole site, which you will find in full on the Ergodicity page: the only average an investor should care about is the geometric one. The arithmetic mean is the average across possible worlds; the geometric mean belongs to your one account, which lives through time and carries its past losses with it. The +114% is an arithmetic mean on capital put back on the table every quarter: it is not the return of any investable balance — no fund where you deposit 100 and watch the NAV grow has ever compounded at that pace, and indeed Universa’s own portfolio metric speaks of about 2 extra percentage points a year, not 114. And since the programs are tailored to each client, none of these numbers necessarily represents any specific investor’s experience. The more spectacular the number, the more it pays to ask two things: what sits in the denominator, and which average was used. It holds for Universa and holds identically for anyone showing you a track record.
May 2020: clash of the titans#
The taste for controversy, as I was saying. Before the 2023 investigation there had already been the week when the tail-hedging debate stopped sounding like a finance seminar and became the best show available on Twitter. Spring 2020: markets are climbing back from March’s −34%, Universa has just mailed its “decennial letter”, AQR has just published its papers against systematic puts. Perfect conditions.
On May 20 Taleb opens hostilities: “AQR issued 2 flawed reports saying tail risk hedging doesn’t work (in theory), options are ’expensive’. Yet they did not reveal that 1) Their OWN risk premia strategies lost money. 2) Their other public crap underperforms the MKT. Insult to clients & the REAL WORLD.” The two “flawed” reports are Ilmanen’s, which you will meet in a moment; the charge is that AQR criticizes other people’s insurance while its own risk premia funds lose money — and note the “public crap” reserved for the firm’s other products: the tone is declared from the opening shot. Asness does not need to be asked twice and goes straight to the personal: Taleb, to him, is “very wrong and clearly both nuts and a world class terrible person”. From there the inventory grows with every exchange — nasty, overrated, unoriginal, illogical, pretentious, emetic — all of it in public, in front of hundreds of thousands of followers. On the merits, when they resurface, Asness accuses Taleb of comparing “apples to hippopotamuses”: the return of a hedge that explodes in crashes set next to that of long funds with an entirely different profile. The most melancholy detail comes from the chronicles: according to Asness, the two used to be friends. Bloomberg devotes an article to the “vitriolic” dispute; Taleb, olympian, addresses the audience: “For the general public watching the road rage of Mr Asness…”, barely concedes his opponent exists: “The responses of Cliff Asness to this thread have been vastly… nontechnical.”, and twists the knife in a post scriptum: “PS- I have no interest in Asness, not even AQR, but they can’t get away w/nonsensical claims abt tail risk.”
On May 22 Taleb widens the front with a thread on how much Mandelbrot despised Eugene Fama: an attack on the foundations, given that Asness is a student of Fama’s from Chicago and all of AQR’s factor investing descends from the efficient-markets school. The brawl becomes a war of statistical religion: fat tails versus factors. On the 24th Asness slams the door: “Finally blocked the nut job. Astounding that the best he ever came up with is ‘you are.’” On the 26th Taleb announces a “Symposium on risk parity” — short videos against the “absurdities” of diversification theories, in the wake of the road rage of the man he now calls “the lunatic of #AQR” — and blocks non-scientific commentators, Asness included. Having blocked each other, the fire dies out the way it flared up: within a week.
What remains, beneath the insults? Two real and opposite arguments — convexity that average returns measure badly, the cherry-picking of comparisons — which is exactly the trial of the next section, stripped of the vitriol. And a tentative lesson I have kept in mind ever since: when a technical debate degenerates like this, it is usually because the data cannot settle it. If they could, one of the two would have stopped tweeting and shown the table.
The trial: prosecution and defense#
Beyond the denominator, the substantive criticisms are two, and both deserve the benefit of cross-examination.
The first is AQR’s institutional position, built across a series of papers (Ilmanen above all, “Chasing Your Own Tail (Risk)”, 2012 and 2019): systematically buying puts is structurally too expensive — the premium drag erodes more over the long run than the protection gives back in crashes, and alternatives such as trend following or plain de-risking protect better per dollar spent. Note the irony of my position: the drag AQR denounces is exactly the VRP I try to collect. If AQR is right, my trade makes sense; if Spitznagel is right, the premium I believe I harvest is an optical illusion, at least against a counterparty as skilled as he is. I cannot root for either side without a conflict of interest, and I’m declaring it to you.
To AQR’s critique, buyers of tail risk protection reply with the most fascinating argument in the repertoire, which belongs to Taleb even before Universa: tail insurance would be mispriced from the start, because the market — models, habits, risk managers — prices options on probabilities observed in the past, and under fat tails the past is a lying sample: the worst event ever seen understates the worst event possible. If that is right, far-OTM puts are systematically at a discount exactly where it matters, and the patient buyer is buying a risk the seller does not know they are selling — the peso risk of the Volatility risk premium page, seen from the side of whoever buys the protection. The argument is serious in theory; it is its application to SPX options that I personally struggle to follow. Index options are among the deepest and most competitive markets on the planet, and they have been pricing fat tails for decades: since 1987 the distribution implied in prices has carried an enormous left tail — Jackwerth and Rubinstein estimated that after the crash the market priced a three-to-four standard deviation decline as ten to a hundred times more likely than under a lognormal — and that is why the skew of the Options page exists. If anything, the empirical evidence points the other way: index puts turn out to be historically overpriced even after accounting for peso risk (Bondarenko computes that, to break even, ATM puts would have needed an October 1987 every nine months). Where the underpricing argument becomes plausible is in niche markets — few counterparties, scarce specialized capital, one-sided hedging demand: an option on some exotic agricultural commodity, not the most traded derivative in the world. It is the logic of Gârleanu, Pedersen and Poteshman’s demand-based option pricing: prices drift where intermediaries cannot hedge and demand pushes on one side only — conditions rarely seen on the SPX, and always seen in thin markets. There remains the thesis’s last refuge: the extreme tail, the one no sample can measure by definition. There, underpricing cannot be ruled out — nor proven, and that is exactly the point where the debate stops being empirical.
The second criticism arrived “with facts”, and the facts punished it immediately. In early 2020 CalPERS — America’s largest pension fund — shut down its tail hedging program with Universa, with CIO Ben Meng explaining that strategies of this kind are costly and inefficient compared to cheaper alternatives. A few weeks later COVID arrived: the protection just dismantled would have paid out roughly one billion dollars. The episode cuts both ways, which is why I find it instructive: on one side it shows that even a sophisticated investor, looking at cumulative costs, judges the program too expensive — which is evidence in favor of the VRP’s existence; on the other it shows, in the most expensive way possible, what it means to cancel the policy the day before the fire. On a sample of one event, though, neither reading can claim to be proven (it is the sample problem you will meet again on the Tail risk page: observable crashes are too few to settle the argument).
And the defense? Spitznagel replies that the only sensible metric is the effect on the client’s whole portfolio — the 11.8% versus 9.6% comparison from a moment ago — and on this, curiously, he agrees with his critics: Brown too concludes that the rational way to assess Universa is the +12.8% of March 2020 against the −0.22% monthly of the quiet years, not the +4,144%. Independent checks (Michael Edesess in Advisor Perspectives) find the declared portfolio numbers plausible; technical replies to the AQR papers (Federico Carrone) argue that AQR answers the wrong question, evaluating the puts as a standalone investment rather than as a modification of the whole portfolio’s profile. These are serious arguments. But right here sits the point that keeps nagging at me: if the solid metric is enough to defend the strategy, what is the spectacular number for? A +12.8% in a month like March 2020 is a result that defends itself. A +4,144% is a number that needs explaining, contextualizing, defending with asterisks — and meanwhile it travels around the world. The most charitable reading is that the ROIC better describes the strategy’s internal efficiency (how much payoff per dollar of premium); the least charitable is that the big number exists because the big number works. I have no way of knowing which is true. Probably a bit of both.
What I take home#
Three things, in order of importance.
The denominator is the message. Universa’s numbers are not false: they are well dressed. It is the chapter’s general lesson, and it holds far beyond Universa: every time someone shows you a return — a fund, a backtest, the seller of an option selling course with a +300% screenshot — the first question is not “how much”, but “divided by what”. If this site ever shows you percentages without telling you the denominator, close it.
The debate is not settled, and may not be settleable. AQR and Universa are fighting over the same handful of observed crashes, and on samples that small both narratives survive any data. I keep the prudent version for myself: the VRP exists as an average premium (the evidence on the Volatility risk premium page remains the most solid we have), which makes systematic tail hedging expensive on average — and it can still make sense for whoever has constraints that don’t allow them to survive the tail. Expensive and rational are not mutually exclusive: that is the nature of all insurance.
Universa’s existence is good news for the seller. A systematic, declared and price-insensitive buyer of far-OTM puts is exactly the kind of structural demand that keeps alive the premium I collect — Litterman, in the Resources, explains who should buy that protection; Universa is proof that someone actually does, in billions. From my side of the table, the curious case is not a threat: it is the counterparty.
And with that, the Derivatives section has said everything it needed to: the instruments, the premium, the architecture to collect it, and even a portrait of who sits on the other side. The leverage of the previous page multiplies the premium and multiplies the tail identically; Universa has just reminded us how much that tail can pay, to whoever owns it. Welcome to the Risk management section.
Sources#
The criticisms:
- Justina Lee — Why One Firm’s 3,612% Return Is Drawing the Ire of Hedge Funds (Bloomberg News, April 2023; freely accessible version at Financial Advisor Magazine). The pivotal investigation: the cherry-picking accusations, the Weinstein and Kaufman quotes, the finding that 7 out of 8 tail managers use conventional metrics.
- Aaron Brown — Those Astronomical Returns Aren’t What They Seem (Bloomberg Opinion, May 2020; via WealthManagement.com). The recalculation of the +4,144%: roughly +12.8% on the portfolio for the month, against an average −0.22% monthly in the years without crashes.
- Aaron Brown — Universa’s 3,126% Black Swan Return Is Legit (But With an Asterisk) (Bloomberg Opinion, April 2023; non-paywalled summary). The fire-insurance analogy and the asterisk on quarterly rebalancing.
- Bloomberg News — Black Swan Author Spars With Quant Legend Over Tail Risk Hedges (May 2020). The chronicle of the Taleb-Asness clash; the Taleb-side archive is at nassimtaleb.org. The original tweets: the May 20 opener, the “road rage” and the “nontechnical” reply.
- Nir Kaissar — Taleb-Asness Black Swan Spat Is a Teaching Moment (Bloomberg Opinion, May 2020). A third-party analysis of the debate, while the insults were still warm.
- RCM Alternatives — The Great Tail Risk Debate, Dealbreaker — Taleb vs Asness and HumbleDollar — No, I’m Better (May 2020). The week’s chronicles, verbatim insults included.
- Antti Ilmanen — Chasing Your Own Tail (Risk) (AQR White Paper, 2012) and Chasing Your Own Tail (Risk), Revisited (2019). The institutional position: systematically buying puts is structurally too expensive.
- AQR — Tail Risk Hedging: Contrasting Put and Trend Strategies (2020) and Asness et al. — Portfolio Protection? It’s a Long (Term) Story… (Alternative Thinking 2Q 2020, then Journal of Portfolio Management 2021). Asness’s direct reply to the 2020 debate.
- Leanna Orr — The Inside Story of CalPERS’ Untimely Tail-Hedge Unwind (Institutional Investor, April 2020) and CalPERS CIO Called Out By Ex-Head of Tail-Risk Program. The CalPERS affair from both sides.
- Michelle Celarier — Nassim Taleb — and Universa — Versus the World (Institutional Investor). The big picture of the controversy.
The facts:
- Bloomberg News — Nassim Taleb-Advised Universa Tail Fund Returned 3,600% in March (April 2020). The article that spread the original number.
- Risk.net — The Universa approach to hedging tail risk. The technical description of the strategy.
- Wikipedia — Universa Investments. Overview of declared returns and events.
- Jackwerth, Rubinstein — Recovering Probability Distributions from Option Prices (Journal of Finance 1996). After 1987 the distribution implied in index options carries an enormous left tail: the SPX market has been pricing fat tails for decades.
- Oleg Bondarenko — Why Are Put Options So Expensive? (Quarterly Journal of Finance 2014). Index puts turn out overpriced even with methodologies robust to peso risk: to break even, ATM puts would have needed an October 1987 every nine months.
- Gârleanu, Pedersen, Poteshman — Demand-Based Option Pricing (Review of Financial Studies 2009). Where demand pushes one way and intermediaries cannot hedge, prices drift: the theoretical door to mispricing in thin markets.
The defenses:
- Mark Spitznagel — Safe Haven: Investing for Financial Storms (Wiley, 2021). The cost-effective risk mitigation thesis and the Risk Mitigation Scorecard.
- Michael Edesess — Empirical Support for Tail Risk Strategies (Advisor Perspectives, July 2020). An independent empirical check of Spitznagel’s claims.
- Federico Carrone — The Tail Hedge Debate: Spitznagel Is Right, AQR Is Answering the Wrong Question. The technical reply to the AQR papers.
- Asymmetric Finance — Ignore AQR, You Must Hedge Your Portfolio. A partisan defense, to complete the cross-examination.