


Tail risk#
On October 19, 1987, the S&P 500 lost 20.5% in a single session. With the volatility of the time, under a Gaussian assumption, that was an event of more than twenty standard deviations: something that, if returns were truly normal, shouldn’t happen even once in the life of the universe, multiplied by billions. It happened, and it is the memento mori hanging on the wall of every volatility seller — the day that created the skew (see the Options page), rewrote the models and defined, once and for all, the trade described in these pages. This page is devoted to tails: what they really look like, when and how they arrive, what makes them (partially) manageable and what doesn’t. It is the least pleasant page on the site and the most important.
Tails are fat: the empirical fact#
The distribution of equity returns is not Gaussian, and the difference is not an academic quibble. Daily index returns show high excess kurtosis and tails that decay as power laws — the econophysics literature (Bouchaud and Potters, Theory of Financial Risk, is the reference I use) estimates tail exponents around 3-4: fat enough to make 5-10 sigma events not cosmic rarities but facts that every generation of investors meets more than once. The structural reasons are at least three, and they reinforce each other. First, volatility is not constant: it moves in regimes, and a mixture of Gaussians with varying volatility produces fat tails even if every single day were “normal”. Second, there are genuine jumps: price discontinuities that no continuous process generates — the post-9/11 reopening, the futures lock-limit of October 2008, the −12% of March 16, 2020. Third, feedback mechanisms: stop-losses that sell into declines, dealers’ gamma hedging that amplifies moves, forced deleveraging — the market contains circuits that turn sparks into wildfires (1987 itself was largely a portfolio insurance accident, i.e. mass mechanical hedging).
For the option seller, fat tails have two faces that must be looked at together. The bad face: the potential loss of a sold put is governed by the tail, and the tail is far more populated than Gaussian intuition suggests. The interesting face: the options market knows it — the skew from the Options page is precisely the price of fat tails — and tends to overprice them: as seen in Volatility risk premium, the Q probabilities of a crash systematically exceed the P frequencies. Selling puts therefore means selling tails at a price that is, on average, above their cost.
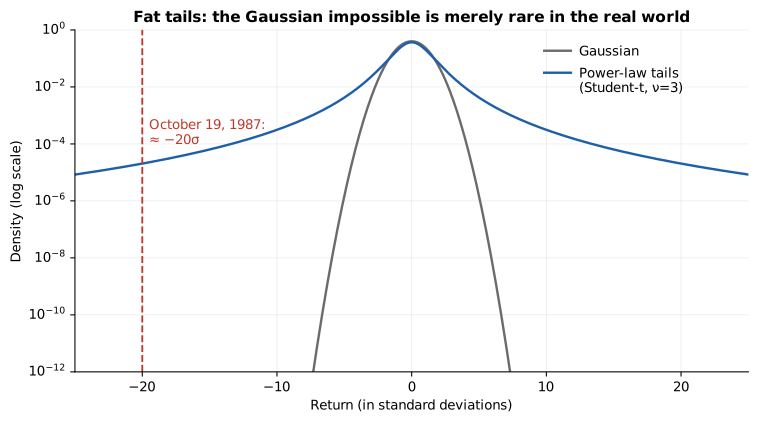
On a log scale the difference leaps out: at −20σ the Gaussian density is zero for every practical purpose, the fat-tailed one is not. 1987 lives in the blue curve. “On average” is doing enormous work in that sentence: the average includes the years when you pay the claim, and it includes — this is the point of the Peso problem — the claims your sample has never seen. Part of the premium you collect is compensation for the 1987 that hasn’t recurred yet; Constantinides and coauthors find that roughly a quarter of the anomalous return of short-dated OTM puts remains unexplained even by crisis factors, and it’s prudent to treat that quarter as the price of the event missing from the sample, not as free alpha.
The decisive question: do crashes give warning?#
For someone selling one-day options, the operational question is not “how fat are the tails” but “how much warning do they give”. If volatility rises gradually before big crashes, a strategy that recalibrates its strikes every evening on the current IV level automatically moves away from danger. If crashes come out of nowhere, no recalibration can save you.
Basic statistics argue in favor of advance warning, and it’s one of the most solid facts in all of empirical finance: volatility clustering. Volatility is strongly autocorrelated — turbulent days cluster into episodes lasting weeks, and so do calm days (it’s the regularity the GARCH family of models formalizes, but the raw observation is enough here). A large daily move is almost always preceded by above-average moves in the preceding days; and since IV reacts to realized vol, the price of insurance also rises before the big storm. Add the leverage effect: volatility rises when prices fall (and vice versa), so the regimes dangerous for a put seller announce themselves with a double signal — a falling market and rising IV — both observable the evening before, at the moment you choose your strike.
The specific evidence on crashes confirms it. The TRPS source (see the Resources page) built the analysis I like best: every daily decline in the S&P 500 since 1987, crossed with the VIX level (VXO before 1990) at the close of the previous day. The result: virtually all the catastrophic declines — 1987, the worst sessions of the 2008-09 crisis, March 2020 — occurred with implied volatility already elevated the day before. The perfect storm almost always arrives on a sea that is already rough: “you don’t go from the 2019 market to the pandemic market overnight; volatility builds over time”. This is the statistical foundation of the TRPS strategy: when the VIX rises, the “sell at IV ≈ 2× VIX” rule pushes the strikes so far away that even the −12% of March 16, 2020 never reached the puts sold the evening before. The dangerous policies underwritten in fair weather had already expired; the new ones had been priced with the sea already rough.
Comforting, not guaranteed. The exceptions exist and must be listed without discounts. The matrix contains at least one 5-7% decline with implied volatility below 20 the day before (1989). Flash crashes — May 2010, August 2015, February 2018, the mini-versions of October-November 2025 — compress weeks’ worth of movement into minutes, with liquidity evaporating exactly when it’s needed. And above all there’s the category where the warning arrives outside market hours: overnight gaps. It’s worth quantifying the weight of the night, because it surprises: the closed hours cover about two thirds of clock time but, more importantly, they are when the gap-capable news concentrates — pre-open macro releases, foreign central bank meetings, geopolitical events, earnings. The 1DTE paper (see the Volatility risk premium page) was born precisely from this observation: the most important moves of recent history happened with markets closed — the futures lock-limit in 2008 was pre-market, the March 16, 2020 crash formed largely overnight, the Bank of Japan shock of August 2024 opened positions beyond any stop. 1DTE puts sleep uncovered: stops on SPX don’t operate at night, and any overnight watch must go through the ES future, the only instrument that trades nearly 24 hours (see the Futures page). On that hook hang the two automatable night guards — buying back the put conditional on an ES level, or native stops on the futures that mount a static hedge at the trigger — described on The TRPS bot page; and, at the root, there remains the defense that depends on no order: leverage chosen so that even the worst night is survivable. Let me add the macro announcement days: the 1DTE paper documents that one-day option returns are dramatically different on inflation, employment and FOMC days — the premium is richer, because that’s where the risk concentrates. It’s not a reason to avoid them; it’s a reason to know that the economic calendar is part of the distribution.
What works and what doesn’t#
From the evidence follows a hierarchy of defenses, which takes the three levels from the Risk management page and applies them to the tail.
Works: shortening time. Short expiration is structural defense number one, through two distinct mechanisms. The daily strike reset incorporates each evening’s latest information on volatility (the warning, when there is one, gets used). And the minuscule vega of short expirations prevents the mechanism that destroyed the long-dated strategies — options repricing via delta-gamma-vega, without the strike ever being threatened — from operating at scale. XIV, OptionSellers and UBS all shared long expirations; no 1DTE strategy appears in that graveyard, and March 2020 was, for the TRPS’s fifteen-year track record, the most profitable month ever.
Works: conditioning on the regime. Strikes chosen as a function of current IV (the VIX-multiple rule), and for tactical long-dated positions the inverse: selling them only when the VIX is high, when the rate already prices the catastrophe (the 70% OTM puts of the tactical leg, see the TRPS page). Conditioning is the operational translation of clustering: since tomorrow’s risk is well estimated by today’s volatility, a rule anchored to today’s volatility is a rule that chases risk instead of suffering it.
Half works: stops. They convert rare, large losses into small, frequent ones — a good actuarial deal — but they fail in exactly the extreme scenarios: in gaps they don’t exist, in flash crashes they fill at absurd prices (the grotesque fills of October 2025 that pushed the TRPS to stop-limits). They should be used and never counted on: their failure must already be built into the sizing.
Doesn’t work: the statistical blanket. More backtests, more parameters, more optimization neither lengthen the sample nor insert the missing event into it. Against Knightian uncertainty, the only defense is structural: leverage. If the index opened tomorrow at −15%, beyond the strikes, at 3-4x leverage the TRPS loses on the order of 30-40% of the account: a serious, survivable wound. At 10x leverage it’s the end. The difference between the two scenarios doesn’t depend on the market, the model or luck: it depends on a number chosen at the desk, beforehand.
And here the page passes the baton. Because “survivable” is not a feeling but a precise mathematical concept — it concerns the difference between the average across possible scenarios and the average of your path through time, and the exact point where the two diverge forever. It’s called ergodicity, and it’s the next page.