


The third leg: CTA and short-vol#
The CTA trend following page closed on a legitimate question: why keep in the portfolio a strategy with an expected Sharpe of 0.3-0.5 next to two strategies that, taken on their own, earn more per unit of risk? If the portfolio were a league table, the answer would be: don’t keep it. But a portfolio doesn’t add up Sharpes — it adds up payoffs, day by day, and two payoffs that offset each other at the right moments are worth more than the sum of their averages. This page is the argument for why the third leg exists: trend following is, structurally, the mirror image of volatility selling, and its best days are scheduled to fall in the other two’s worst years.
The synthetic straddle#
What does a trend chaser have to do with an options buyer? Everything — and not as a suggestive analogy, but as a fact of structure the literature has proved from two independent directions. Fung and Hsieh (The Risk in Hedge Fund Strategies: Theory and Evidence from Trend Followers) showed that trend followers’ returns are explained by those of a lookback straddle — the exotic option that pays the difference between the period’s maximum and minimum: whoever chases the trend, buying what rises and selling what falls, ends up replicating a long options position on movement, whichever direction the movement comes from. Dao and the CFM coauthors (Tail Protection for Long Investors: Trend Convexity at Work) made the result quantitative: a trend follower’s P&L over long windows is, to first order, long the long-term variance and short the short-term one — a profile convex in the market’s return, the smile you see in the left panel of the chart. The strategy loses little and often when the world vibrates without going anywhere, and earns a lot when the world goes somewhere, no matter where.
Now flip the chart over and you have the other two legs’ trade. A sold put — hedged or not — is a concave payoff: it collects little and often when nothing happens, loses big when something does. The short-vol book sells an insurance policy and gets paid in premiums; trend following buys one and pays for it in whipsaw. The decisive difference from buying true protection — the long puts, the VIX, the long volatility products of the Futures page — is the price: explicit protection costs the VRP, that is, exactly the premium the first two legs toil to collect, and holding it in the portfolio permanently is a certain hemorrhage; the trend’s convexity, historically, has charged little or nothing — Dao calls it the cheap protection — because it’s not a purchased option but a replicated one, whose cost is the whipsaw of sideways markets. Kat (Managed Futures and Hedge Funds: A Match Made in Heaven) closes the circle from the distribution side: adding managed futures to a portfolio that sells options cures precisely that portfolio’s two pathologies, the negative skew and the kurtosis — less left tail, thinner tails overall — because trend following’s skew is positive: many small losses, few big wins. It’s the exact reverse of our daily trade.
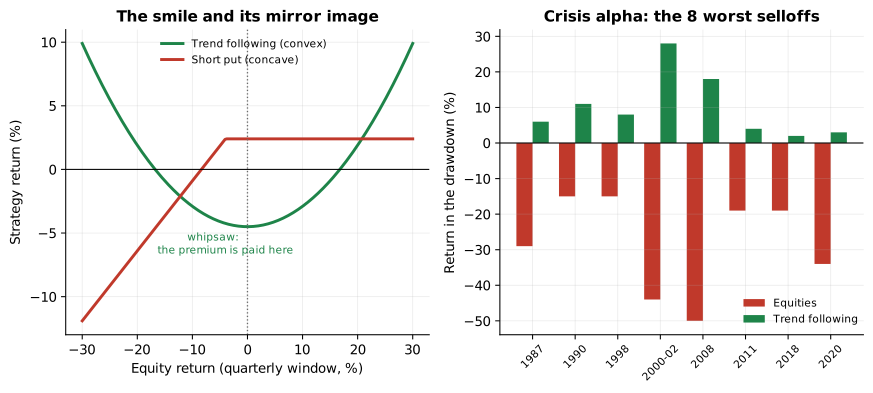
Left, the trend-following “smile” (strategy return against equity return over quarterly windows) overlaid on the short put’s concave profile: each is the mirror image of the other. Right, the behavior in the eight worst equity crises since 1985: where equities sink, trend harvests. Illustrative numbers, reconstructed from the cited literature.
Crisis alpha and inflation#
The convex structure produces a phenomenon the industry calls crisis alpha, and the literature has measured it with embarrassing regularity. Harvey and coauthors (The Best of Strategies for the Worst of Times: Can Portfolios Be Crisis-Proofed?) examine the eight worst equity drawdowns since 1985 — from the Black Monday of 1987 to the 2008 crisis — and find trend following profitable in all eight; the same study estimates that as little as 10% of the portfolio allocated to a dynamic hedge of this kind would have improved every single historical drawdown of the overall portfolio. Hutchinson and O’Brien (Is This Time Different? Trend Following and Financial Crises) confirm on a century-long sample: in financial crises the strategy returns more on average than in normal times, with commodities — which an index-option portfolio never touches — as the engine precisely in the quarters when equity sinks. And Hamill, Rattray and van Hemert (Trend Following: Equity and Bond Crisis Alpha) add the operational detail that justifies a design choice from the previous page: the protection in crashes comes from the short lookbacks — 1-4 months, the ones that turn in time — while the 12-month on its own arrived late in the last three big selloffs; and in equity crises trend wants the bonds long, riding the flight-to-quality, which is why the rates leg stays free to go wherever the signal takes it.
Then there’s the second scenario, the one 2022 served as the reminder of: inflation. Neville, Draaisma, Funnell, Harvey and van Hemert (The Best Strategies for Inflationary Times) survey the eight US inflationary regimes of a century and find trend following in the black in all eight — the liquid strategy that comes through them best of all — because inflation is by construction a persistent phenomenon: commodities rising for quarters, bonds falling for quarters, exactly the signal’s bread and butter. Note carefully what that means for this portfolio: inflation is the scenario in which short puts and bond collateral suffer together — equities fall in installments with realized vol high, bonds don’t protect because they are the cause of the problem, and the negative stock-bond correlation the common intuition rests on reveals itself for what it is, an anomaly of the post-2000 years, not a law of nature. The two scenarios in which the rest of the account has no defenses — the prolonged decline and persistent inflation — are the two scenarios in which trend following has its best track record. That coincidence, not the Sharpe, is the reason for the third leg.
What it covers and what it doesn’t#
Honesty requires drawing the perimeter, because crisis alpha is a statistical property, not a contractual guarantee. The trend’s convexity lives on moves that last: weeks, months. On a one-to-two-day jump — the overnight gap that is the TRPS’s personal monster — the signal materially has no time to turn: Dao states it without circumlocution, trend following does not cover the lightning crashes. The division of labor inside the system is therefore clean: the jumps remain the business of the guardrails — the stops, the night guard, the leverage sized on the disaster of the Ergodicity page — while the third leg watches over the prolonged declines, which are incidentally the scenario stops and guards can do least against: a stop protects from the bad night, not from a 2008 that lasts fifteen months. To each its own monster.
The second limit is the case in which everything stops at once: Asness, Moskowitz and Pedersen (Value and Momentum Everywhere) document that in liquidity and funding squeezes momentum suffers everywhere simultaneously, and an August 2007 — quant funds forced to unwind the same positions in the same days — hits the third leg exactly while the other two are collecting their vega spike. It’s rare, it’s documented, and it’s why the third leg has its caps and its drawdown brake (The CTA bot page) instead of being treated as an infallible insurance policy. The house rule doesn’t change: every leg is sized as if its worst-case scenario were due tonight.
The three-legged portfolio#
The argument accepted, the practical question remains: with what money does the third leg get mounted? The answer was already written on the Capital efficiency page. Futures are held on margin: the CTA position asks for no dedicated capital, only a fraction of maintenance margin — on the order of 7-12% of the account value for the whole universe at steady state — that coexists with the options overlay’s under the same roof and the same margin gate. The trend premium therefore stacks on top of the others: the same dollar of collateral harvests ERP and TRP through the portfolio, VRP through the puts, and trend premium through the futures — return stacking taken from two layers to three, same principle, new source. With a margin caveat the bot treats as a fact and not a footnote: in vol spikes futures margins rise exactly while the short-put book is consuming its own, and the shared margin gate is the referee that decides who may open risk and who may not.
The success metric, consequently, is not the leg’s Sharpe but the shape of the combination: the total portfolio’s skew climbing back toward zero, the kurtosis coming down, the joint drawdown in the 2008 and 2022 scenarios getting shorter — Kat, again, for the distribution theory. It’s the same reasoning with which the TRPS vs DHCS page combined the first two legs — the diversification you can’t find across assets you find again across architectures — pushed one step further: TRPS and DHCS diversify the path within the same premium; the CTA diversifies the premium. The proportion, as always, is governed by the single stress budget: I fix the tolerable loss in the joint worst-case scenario, and within that budget the third leg takes the place its 20-25% drawdowns allow it, not a point more.
The what and the why end here. The how remains: one cycle a day, a roll calendar across fifteen markets, a three-strategy position ledger and the guardrails that keep everything on the rails — that’s The CTA bot page.